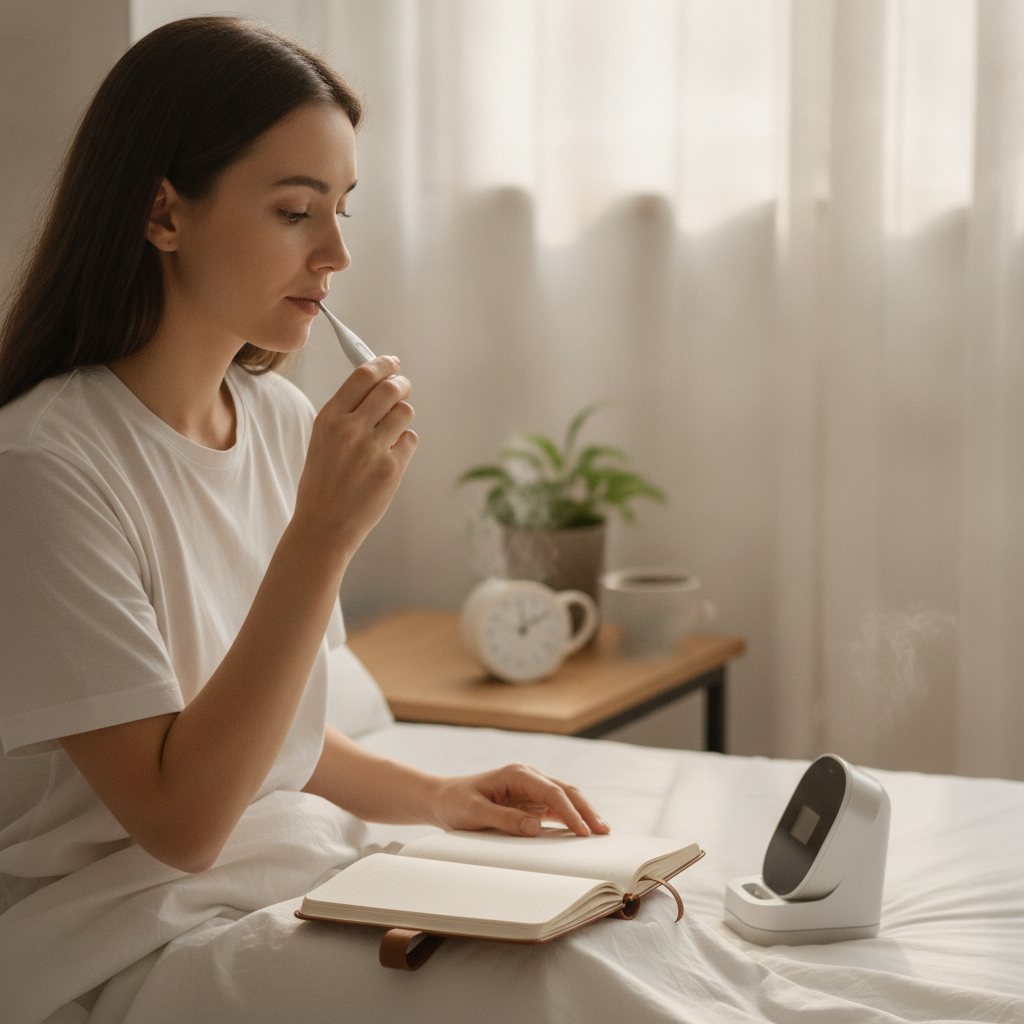
Basal body temperature — measured consistently before rising each morning — carries biological information that step counters, sleep scores, and heart rate monitors simply cannot access. While wearables from Garmin, Oura, and Apple have made biometric tracking more popular than ever, they largely interpret the body through movement, rhythm, and pulse. Temperature, logged manually at the same time each morning over four weeks, reveals a quieter and more nuanced story: one written in fractions of a degree, shaped by hormones, recovery debt, and metabolic state.
What Basal Body Temperature Actually Measures
Basal body temperature (BBT) refers to the body's resting temperature, taken before any physical activity, food, or significant movement. For the measurement to mean anything, consistency matters enormously — same time, same thermometer, same position in bed. A standard oral thermometer works, though dedicated BBT thermometers from brands like Femometer or Easy@Home offer finer decimal resolution. The number itself, typically somewhere between 36.1°C and 37.2°C depending on the individual, is less important than the pattern it traces across weeks. That pattern is where the real signal lives.
The Hormonal Architecture Behind the Numbers
In individuals with a menstrual cycle, BBT follows a predictable biphasic pattern governed by estrogen and progesterone. Temperatures tend to run lower in the follicular phase and rise noticeably — often by 0.2°C to 0.5°C — following ovulation, as progesterone takes over. This shift, called the luteal phase rise, persists until menstruation begins. Tracking this rhythm over four weeks doesn't just confirm ovulation timing; it reveals whether progesterone output is sustained, whether the cycle is consistent, and whether hormonal transitions align with reported energy, mood, and sleep quality. No app's algorithm reconstructs this from steps or sleep stages alone.
How Recovery and Stress Alter the Temperature Signal
Beyond reproductive hormones, BBT responds to the body's broader physiological load. Inadequate sleep, high training volume, alcohol consumption, or elevated cortisol from sustained stress can all suppress or distort morning temperature readings. A temperature that sits unusually low for several consecutive days — outside any expected hormonal phase — often reflects accumulated recovery debt or immune activation. Athletes who track BBT alongside their training logs sometimes notice temperature dips that precede performance plateaus, offering an early signal to reduce intensity before symptoms of overtraining become obvious. This kind of pattern recognition isn't available from a single-day reading.
The Four-Week Commitment and What It Requires
For the data to be interpretable, four weeks of measurements need a disciplined framework. Taking temperature within the same 30-minute window each morning — ideally after at least five hours of uninterrupted sleep — is the baseline requirement. You'll want to log the reading immediately, along with two or three contextual notes: sleep quality, alcohol from the night before, illness symptoms, or unusual stress. A simple notebook works; apps like Clue or Kindara provide structured logging with visual charts that make phase patterns easier to recognize. The investment per day is under two minutes, but the accumulated picture takes shape only when viewed across the full four weeks.
What the Pattern Reveals That Fitness Apps Miss
Most fitness platforms are built around output metrics — calories burned, distance covered, readiness scores derived from heart rate variability. Temperature tracking captures something upstream of all of that: the hormonal and metabolic environment in which the body is operating. A woman whose fitness app shows a high readiness score but whose BBT chart shows a blunted luteal phase has information the app doesn't. A person recovering from illness whose BBT remains elevated for days after symptoms resolve understands that the immune response is still active, even when energy feels restored. The granularity that temperature offers is different in kind, not just degree, from what pulse-based metrics provide.
Turning Four Weeks of Data Into Actionable Insight
Once you have a full cycle or four consecutive weeks of readings, look for three things: the overall range of your baseline temperature, any consistent shift that aligns with a mid-cycle rise, and outlier readings that correspond to logged stressors or poor sleep. If the biphasic pattern is clearly present, you have confirmation of ovulation and can begin correlating the phases with your subjective experience of energy and recovery. If the pattern is flat or erratic, that itself is informative — worth discussing with a healthcare provider rather than self-diagnosing. Share the logged chart, not just your recollection. A four-week paper or app-generated graph communicates what words rarely can.
As consumer health technology continues developing, temperature tracking is beginning to appear in wearable form — embedded in rings and patches that promise continuous measurement. But morning consistency, logged with intention and context, remains the most interpretable format available. The future of personal health monitoring will likely integrate temperature with hormone assay data and continuous glucose readings, but the practice of observing a single daily number with care and curiosity is already revealing patterns worth understanding.